




Golf statistics 2026The Benchmark Golf Swing Report
Published and updated
Where the club meets the ground on every swing, measured on the Golf at Home mat, alongside 48 sourced statistics on how golfers score, miss, practice and play.
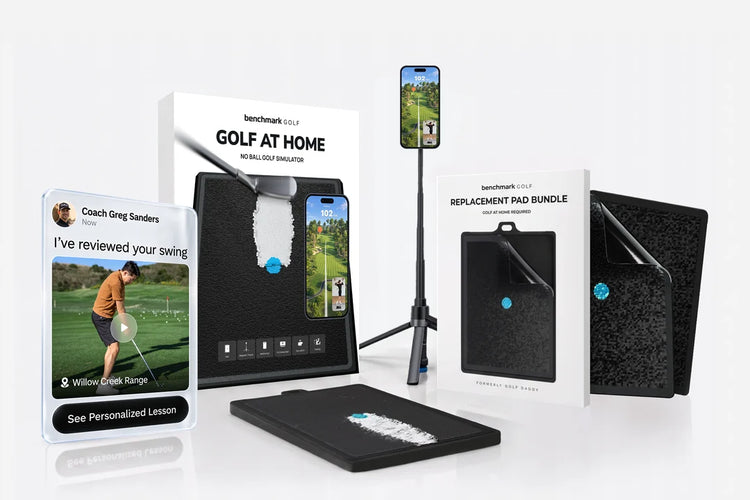
Benchmark Golf app footage: each strike pattern on the mat, with its simulated ball flight. Shares are of all swings among Golf at Home users; a swing can count under more than one pattern.
At a glance
Key golf statistics for 2026
- Among Golf at Home users, pure contact moves from 7% toward 40% after one week of practice (Benchmark Golf).
- Among Golf at Home users, 25% of swings are fat and 25% are thin (Benchmark Golf).
- 48.1 million Americans played golf in 2025, a record (NGF).
- U.S. golfers who keep score average 94 for 18 holes (NGF, self-reported).
- The average Handicap Index is 14.2 for men and 28.7 for women (USGA).
- The average male Arccos golfer drives it 224.1 yards (Arccos, 2025).
- 8.1 million Americans used a golf simulator in 2024, up from 3.8 million in 2015 (NGF).
- Almost half of U.S. rounds are played from May through August (NGF).
- Amateurs who shoot 90 three-putt about 2.3 times per round, four times as often as tour players (Broadie).
Strike patterns
Golf strike patterns: fat, thin, toe, shank and swing path
Launch monitors measure where the ball goes. The Golf at Home mat shows where the club touched: sequins flip wherever the club meets the surface, and a blue dot marks the ball. The only measured public study we found of how often amateurs strike it thin covered 1,127 shots by skilled amateurs [3]. Below, each pattern with its share of swings among Golf at Home users, as reported by Benchmark Golf.
Ground contact
Where the club first touches the mat, relative to the ball.


Strike position
Where along the clubface the ball was struck.


Swing path
The direction the club travels through the ball, read from the angle of the mark.


Patterns as shown in the Benchmark Golf app, for a right-handed golfer; pure contact in green, misses in red. The mat reads where the club touched, not the clubface, so path patterns are named by path. Thresholds between patterns are set in the app. Shares are as reported by Benchmark Golf and add to 110%; a swing may be counted under more than one pattern.
Original data
Original data from the Golf at Home mat
Benchmark Golf data from swings recorded on the Golf at Home mat by golfers practicing at home. Aggregate figures as reported by Benchmark Golf; no individual swing data is published.
Pure contact after one week
7% → toward 40%
Pure-contact rate among Golf at Home users, as reported by Benchmark Golf, and where it moves after one week of practice at home.
Fat or thin
50%
Fat (25%) plus thin (25%), as reported by Benchmark Golf: the club meets the mat too early or too late.
Out-to-in path
22%
The path behind most slices, as reported by Benchmark Golf. In-to-out: 12%.
| Fat | 25% | |
|---|---|---|
| Thin | 25% | |
| Out-to-in | 22% | |
| Shank | 13% | |
| In-to-out | 12% | |
| Pure | 7% | |
| Toe | 6% |
After one week of practice at home, Golf at Home users' swings move toward 40% pure, with fat, thin, toe, shank and out-to-in swings all falling.
Measured on the mat using the app's pattern classification. Not a controlled study; it does not measure ball flight or on-course results.
Sample: Benchmark Golf has not yet published the number of swings or golfers behind these figures.
How to quote it: The 2026 Benchmark Golf Swing Report reported that Golf at Home users' pure-contact rate moved from 7% toward 40% after one week of practice on the mat.
Misses
How amateur golfers miss
The best measured public data on amateur contact and swing path.
| Under 6 | 2.6% | |
|---|---|---|
| 6 to 12 | 6.3% | |
| Over 12 | 14.9% |
| Cat. 1 (lowest) | -0.9° | |
|---|---|---|
| Cat. 2 | -1.9° | |
| Cat. 3 | -3° | |
| Cat. 4 (highest) | -4.7° |
-
2.6% → 14.9%thin strikes
In a measured study of 1,127 five-iron shots by skilled golfers, thin strikes rose from 2.6% of shots for golfers under 6 handicap to 14.9% for those over 12.
96 golfers, mean handicap 5.5, hitting off turf on a range.
-
-0.9° → -4.7°driver club path
In measured driver data from The R&A and USGA, male amateurs' club path averaged -0.9 degrees in the lowest handicap category and -4.7 degrees in the highest. Under the TrackMan convention, a negative path is out-to-in.
The highest category is 101 shots; the report does not state its sign convention.
-
1.41 vs 1.337-iron smash factor
A USGA TrackMan study of 627 golfers measured 7-iron smash factor of 1.41 off hitting mats versus 1.33 off grass, and concluded it is easier to make good contact off mats.
Scoring
Average golf score and handicap
More than 60% of U.S. golfers average above 90. The average Handicap Index is 14.2 for men.
-
94average 18-hole score
U.S. golfers who keep score average 94 for 18 holes, and 77% of golfers keep score regularly. The figure is self-reported; NGF says the true average is probably closer to 100.
-
60%+average above 90
More than 60% of U.S. golfers have an average score above 90.
-
14.2men · 28.7 women
Among U.S. golfers who hold a Handicap Index, the average is 14.2 for men and 28.7 for women.
-
11%of men at 4.9 or better
Almost 11% of U.S. male golfers with a Handicap Index, and about 2% of female golfers, are at 4.9 or lower.
-
19.37average in England
In England the average Handicap Index at the end of 2024 was 19.37: 18.60 for men and 29.33 for women.
-
82Mscores posted
3.68 million U.S. golfers kept a Handicap Index in 2025 and posted a record 82 million scores. 94.4% of those rounds were recreational.
-
76%have broken 90
Among Shot Scope users, about 95% have broken 100 at least once, 76% have broken 90 and 20% have ever broken 80.
Shot Scope users track every round and skew more engaged than the average golfer.
Strokes lost
Where amateur golfers lose strokes
The gap between amateurs and better players is mostly shots from more than 100 yards, plus a few very bad swings.
| Scratch | 61% | |
|---|---|---|
| 5 | 44% | |
| 10 | 36% | |
| 15 | 24% | |
| 20 | 17% | |
| 25 | 10% |
-
9.3strokes from 100+ yards
For a low-handicap amateur (scoring 70 to 83) to match a tour pro, they would need to gain about 9.3 strokes per round on shots over 100 yards, but only 2.2 from putting.
Golfmetrics data, 2005 to 2007, 40,000 shots.
-
6awful shots per round
A golfer who shoots 75 can expect one awful shot per round; a 95-shooter can expect six. For mid-handicaps, fewer than 8% of swings produce over 35% of the shots lost to a scratch golfer.
-
45%of drives in trouble
Among Arccos golfers, 45% of driver tee shots by 30+ handicap men end in a penalty or a recovery shot, versus 12% for 0 to 4.9 handicaps.
Arccos users, 2025 season.
-
61% → 10%greens in regulation
Among Shot Scope users, greens in regulation fall from 61% for scratch golfers to 10% for 25-handicaps, while fairways hit only fall from 50% to 46%.
-
65%of approaches short
The average Shot Scope golfer leaves 65% of approach shots short of the green.
140,000+ Shot Scope golfers.
-
2.3three-putts per round
Amateurs who average 90 three-putt about 2.3 times per round, four times as often as PGA TOUR players (0.55).
-
84%of missed putts finish short
Among Shot Scope users, 84% of missed putts from outside five feet finish short of the hole.
Distance
Average driving distance
The average male Arccos golfer drives it 224 yards, and golfers think they hit it about 7% farther than they do.
| Under 6 | 239.2 yd | |
|---|---|---|
| 6 to 12 | 219.8 yd | |
| 13 to 20 | 200 yd | |
| 21+ | 176.6 yd |
-
224.1yards, men
The average male Arccos golfer drove the ball 224.1 yards in 2025, a figure that has moved less than one yard since 2018.
37,000+ Arccos golfers, about 10 million drives.
-
63yard gap by handicap
Among male Arccos golfers, 0 to 4.9 handicaps average 244 yards off the tee, 63 yards farther than 30+ handicaps at 181 yards.
-
220 vs 145yards, women
Among female Arccos golfers, 0 to 4.9 handicaps average 220 yards off the tee and 30+ handicaps 145 yards.
-
240 vs 190yards by age
Among male Arccos golfers, 15-to-19-year-olds drive it farthest (240 yards) and golfers in their 70s shortest (190 yards).
-
215.6yards, measured
UK male club golfers measured on the course at six venues in 2019 averaged 215.6 yards off the tee, from 239.2 yards (handicap under 6) to 176.6 yards (21+).
-
7%overestimate
Recreational golfers overestimate their typical driver distance by about 7%, and their best drives by 4%.
USGA TrackMan study of 627 golfers.
-
300.2yards on the PGA TOUR
PGA TOUR players averaged 300.2 yards on measured driving holes in 2024, with an average clubhead speed of 115.9 mph.
Participation
How many people play golf
A record 48.1 million Americans played golf in 2025, and a growing share of them play away from the course.
| England | 835,554 | |
|---|---|---|
| Germany | 695,617 | |
| Sweden | 588,069 | |
| France | 446,547 | |
| Spain | 317,155 | |
| Italy | 93,661 |
-
48.1MAmericans played
A record 48.1 million Americans age 6+ played golf in 2025: 29.1 million on a course and 19 million who played only off-course.
-
38Mplay off-course
About 38 million Americans play golf away from the course at entertainment venues, screen golf and ranges, including golfers who also play on a course, versus fewer than 6 million on driving ranges 25 years ago.
-
3.3Mfirst-time golfers
3.3 million Americans played golf on a course for the first time in 2025, and roughly two-thirds of new on-course golfers had already played off-course.
-
8.1Msimulator users
U.S. golf simulator users more than doubled, from 3.8 million in 2015 to 8.1 million in 2024. 51% of them had not played a course in the past year.
-
28%of course golfers are women
A record 8.1 million women and girls played on U.S. courses in 2025, 28% of on-course golfers and up 46% since 2019.
-
500M+rounds played
Americans played more than 500 million rounds in 2025, the sixth straight year above 500 million.
-
16,000U.S. golf courses
The U.S. had about 16,000 golf courses at the end of 2025, roughly 42% of all the golf courses in the world.
-
112.2Moutside the U.S.
112.2 million people played golf in some form in 2025 outside the USA and Mexico; 68.3 million played off-course formats.
-
40.5Min Europe
40.5 million people played golf in Europe in 2025, and registered golfers passed 4.9 million, up 13% since 2020.
-
$2.1Bsimulator market
The global golf simulator market was valued at about USD 2.1 billion in 2025 and is projected to reach USD 4.1 billion by 2033.
Market-research estimate and projection.
Seasons
When golfers play
Almost half of all U.S. rounds are played from May to August. In January, two-thirds of states are in their off-season.
-
~50%of rounds in 4 months
Almost half of all annual U.S. rounds are played from May through August.
-
2 in 3states off-season
In January, about two-thirds of U.S. states are in their golf off-season.
-
7months to post a score
In Minnesota, Michigan, Wisconsin and much of the northern U.S., handicap scores can only be posted from April 1 to October 31.
-
2-3×summer vs. winter rounds
In Great Britain, summer rounds per course run two to three times higher than in the first quarter. A wet winter cut Q1 2024 rounds by 14%.
-
2.2%fewer rounds per inch of rain
Each extra inch of rain cuts U.S. rounds played by about 2.2%, and each degree (F) warmer than the prior year adds about 0.76%.
-
59%of simulator users cite weather
Weather-independent play is the most-cited reason golfers use a simulator (59%), ahead of better practice (43%) and performance feedback (34%).
-
8.4% vs 4%facilities with simulators
Facilities in short-season regions are about twice as likely to have simulators: 8.4% in the Midwest versus 4% in the South.
Practice
How golfers practice and improve
Only about one in five golfers takes lessons. Research on learning favors practice that is spread out and varied.
-
1 in 5take lessons
About one in five U.S. golfers takes professional instruction: about 5.2 million golfers took nearly 27 million lessons in a year.
-
21%never practice
In a GOLF.com reader survey, 21% of golfers said they never practice or visit the range in season, and 11% take regular lessons.
Self-selected survey of nearly 10,000 readers.
-
3.38 vs 1.38handicap shots lowered
Golfers who regularly kept playing stats lowered their handicap by 3.38 shots in a year, versus 1.38 for those who did not.
257 golfers; the authors say the analysis does not show cause.
-
1 in 4beginners stay
Only about one in four golf beginners becomes a committed golfer.
-
29% vs 2%play more vs less on course
Simulator users are far more likely to say they now play more on-course golf (29%) than less (2%). A third have used a home simulator.
-
28days later
In a golf-putting study, practice spread across sessions beat practice crammed into one session, during training and on retention tests up to 28 days later.
-
0.38average effect size
Across 61 motor-learning studies, varied (random) practice beat repetitive (blocked) practice with an average effect size of 0.38; in real-sport settings the effect was smaller (0.19).
Unverified
Golf statistics we could not verify
These figures circulate widely. We looked for the original source and did not find one.
80%
of golfers slice
A common claim, credited to TrackMan or Golf Digest. We found no primary source. The only figure we could open is about 60%, from GOLFTEC lesson data with no stated method, and on-course data from Shot Scope shows only a slight tendency to miss right.
5%
of golfers break 80
Often credited to the NGF alongside "26% break 90". It is not on any NGF page we found, and NGF's own research says almost 1 in 10 golfers regularly shoot under 80.
19M
play on and off the course
One trade article describes NGF's 19 million as golfers who play both. NGF's 19 million are golfers who play only off-course.
Questions
Golf statistics, answered
What is the average golf score?
U.S. golfers who keep score average 94 for 18 holes (National Golf Foundation, 2024). The figure is self-reported, and NGF says the true average is probably closer to 100. More than 60% of golfers average above 90.
What is the average golf handicap?
Among U.S. golfers with a Handicap Index, the average is 14.2 for men and 28.7 for women (USGA, 2024). In England the average was 19.37 at the end of 2024 (England Golf).
How far does the average golfer hit a driver?
The average male Arccos golfer drove it 224.1 yards in 2025 (Arccos). UK male club golfers measured on the course averaged 215.6 yards (USGA and The R&A, 2019 data).
What percentage of golfers slice?
We found no primary source for the common claim that 80% of golfers slice. Measured driver data from The R&A and USGA shows male amateurs' average club path moving further out-to-in (under the TrackMan convention) as handicap rises.
How many people play golf?
A record 48.1 million Americans played golf on or off the course in 2025 (NGF). Outside the USA and Mexico, 112.2 million people played some form of golf (The R&A, 2025).
How often do amateur golfers hit it fat or thin?
In a peer-reviewed study of 1,127 five-iron shots by skilled amateurs, thin strikes rose from 2.6% of shots for golfers under 6 handicap to 14.9% for those over 12 (Corke et al. 2021). Among Golf at Home users, Benchmark Golf reports that 25% of swings are fat and 25% are thin, and that pure contact moves from 7% toward 40% after one week of practice (Benchmark Golf Swing Report 2026).
How many golf courses are in the U.S.?
About 16,000 at the end of 2025, roughly 42% of all golf courses in the world (NGF).
Does practicing on a golf simulator help?
Research on learning favors practice spread across sessions (Dail and Christina 2004) and varied practice (Brady 2004). Evidence on simulator practice is mixed: a 2023 PLOS ONE study found VR putting practice transferred to real putting, while a 2025 study suggests skills practiced in VR may need extra real-world practice. Simulator users are more likely to say they now play more on-course golf (29%) than less (2%) (NGF, 2023).
Method
How this report is made
The mat data
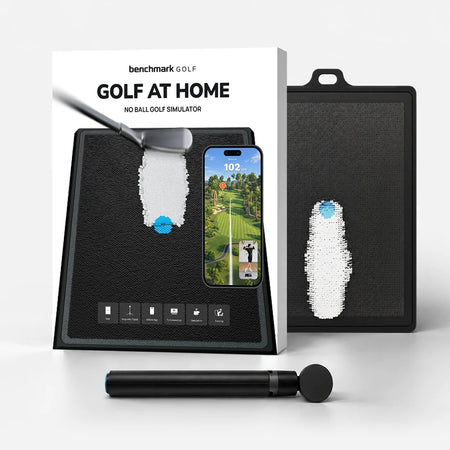
The Golf at Home mat is covered in two-sided sequins that flip where the club touches, and a blue dot marks the ball. The Benchmark Golf app reads each swing's mark: where the club first touched, where it ran and at what angle. The strike mix is the baseline Benchmark Golf reports before the one-week change. Shares add to 110%, so a swing may be counted under more than one pattern. Aggregate figures as reported by Benchmark Golf; we publish no individual data.
A USGA study measured cleaner contact off ordinary hitting mats than off grass [5]. The Golf at Home mat records the mark the club leaves on every swing.
The public data
Every outside figure was checked against its source, with the publisher, year and link beside it. Where we read a figure through a trade article or an archived copy of the page, the source line says "via". Where a figure comes from a tracking company's own users (Arccos, Shot Scope), a self-selected survey or a forecast, the sentence says so. Figures we could not trace are listed under Unverified, not used.
We plan to update this report each quarter.
Cite this report
Benchmark Golf Swing Report 2026. Benchmark Golf. https://benchmarkgolf.com/pages/golf-statistics
Free to quote in articles and research with a link to this page.
Sources
Sources
- National Golf Foundation, "Who's Keeping Score?", Aug 2024
- National Golf Foundation, "Golf's Never-Ending Quest", Sep 2024
- Corke, Betzler, Wallace and Otto, Proc. IMechE Part P, 2021 (1,127 five-iron shots, 96 golfers)
- R&A Rules Ltd. and USGA, "Launch conditions of male and female golfers" (studies 2005-2018), May 2019
- USGA Green Section, "Golfer Performance Measurement" (TrackMan study, 627 golfers), Dec 2023
- USGA, "Are You an Average Golfer?", Sep 2024
- England Golf, "What does a golfer look like in England?", Apr 2025
- USGA press release on 2025 handicap season, Jan 2026
- Golf Monthly, "What percentage of amateur golfers break 80, 90 or 100 at least once" (Shot Scope data), Dec 2025
- Mark Broadie, "Assessing Golfer Performance Using Golfmetrics", Science and Golf V, 2008 (40,000 shots, 130+ golfers)
- Arccos Golf, Annual Driving Distance Report, May 2026 (37,000+ golfers, ~10M drives)
- Shot Scope, "Strokes Gained" ebook (Shot Scope user data)
- GolfWRX with Shot Scope, "What does the average golfer look like?", Mar 2023 (140,000+ golfers)
- Mark Broadie, "Assessing Golfer Performance on the PGA TOUR", Interfaces 42(2), 2012
- Shot Scope, "The Ultimate Golfer's Guide" ebook (Shot Scope user data)
- USGA and The R&A, 2024 Distance Report
- National Golf Foundation, "The Clubhouse: Golf Industry Research"
- National Golf Foundation, "2025 Year-End Letter to the Golf Industry", Dec 2025
- National Golf Foundation, "Female Golf Participation 2026"
- National Golf Foundation, "Golf's State-of-Industry In 3 Minutes", Jan 2026
- National Golf Foundation, "The Golf Simulator Opportunity" white paper, Apr 2025
- National Golf Foundation, "Record Rounds Again in 2025"
- The R&A / Sporting Insights, "Global Golf Participation 2025 (excluding the USA & Mexico)", May 2026
- European Golf Association, "New Participation Report Reveals Continued Growth of Golf Across Europe", 2026
- Grand View Research, "Golf Simulator Market Size and Share Report, 2026-2033"
- National Golf Foundation, "July 2020 National Rounds Played Report" (Golf Datatech data)
- National Golf Foundation, "January 2025 National Rounds Played"
- GOLF.com, "Handicap posting dates 2024" (Allied Golf Association schedules)
- Golf Business News, "Q1 rounds played down 14% in UK" (Sporting Insights data), May 2024
- Golf Datatech (Circana) and WTI, December 2025 National Rounds Played Report, via NGF
- GOLF.com, "How everyday golfers feel about their own games" (nearly 10,000 readers, self-selected), Jun 2025
- Golf Insider UK handicap study (257 golfers, 12 months), Feb 2024
- National Golf Foundation, "Understanding Golf's Biggest Failure (or Opportunity)", Jul 2024
- National Golf Foundation, "Simulator Golf Sees Real Surge", Nov 2023
- Dail T.K. and Christina R.W., Research Quarterly for Exercise and Sport, 2004 (golf putting)
- Brady F., "Contextual interference: a meta-analytic study", Perceptual and Motor Skills 99(1), 2004
- GOLF.com, "The biggest cause of your slice" (GOLFTEC lesson data), Apr 2021
- MyGolfSpy, "What does an average drive look like in 2026?" (Shot Scope 2026 report)
- Markwell L.T. et al., "Off the shelf: transfer of learning using commercially available VR equipment", PLOS ONE, 2023
- Bennett, Neumann and Stainer, Human Movement Science, 2025 (VR putting practice)


